Gaining efficiency and being profitable are the goals of most companies. As great leaders, you have an instinct for your business and marketplace. However, it is hard to rely solely on gut feeling when looking at the financial health of your business. It is critical to also have an objective view based on data. If you are formulating an overall business strategy and want confirmation for the path chosen, that confirmation can be found in past and current financial and project data. Best-in-class companies know that using financial and project information and the resultant key performance indicators (KPIs) are the key to unlocking business strategies.
When defining KPIs, there are important questions that must be answered. What is the desired outcome? Does it matter to the organization? Can it be measured? Who can influence it? Who is responsible? How will we know we have achieved it? How often should it be reviewed? Reviewing KPIs and implementing creative ways to get information to your teams are both equally important. Bulletin boards, dashboards, or a sign in front of your office are all ways to spread information.
In a previous role, I worked for an explosives plant where safety was first and foremost. The sign in the front of the building displayed how many continuous days we had gone without a lost time accident. Every month that there was not an incident the employees got a unique bonus paid in two-dollar bills. It was great for employees but also great for the community. When the two-dollar bills were spent in the community, they knew we were keeping our employees and the town safe. Monitoring the safety within our plant was a critical KPI that our entire company was able to be a part of.
There are seven essential KPIs that should be considered as “standard” in all businesses. (Keep in mind the questions above as we discuss lucky number seven).
#1 Pipeline
The pipeline is the visualization of all the projects to consider and attempt to win. Pipeline goals should be achievable (but not too achievable), measurable, and tactical in the short term and strategic long range. The use of factors such as PWIN (probability of win) will help dial in a more accurate forecast. PWIN represents the probability that your company will win the contract based on discriminators, competition, and other factors.
#2 Revenue
Revenue is the amount of income the organization is making, and the most important metric tracked. The pipeline is the “feeder” for the revenue forecast. Financial team members are not the only ones interested in revenue as the project managers are responsible for meeting their individual revenue goals. Staying on top of the project in real-time increases the probability of execution success.
#3 Labor Utilization
Managing resources is critical, especially in today’s environment where there are major recruiting and retention challenges taking place. Understanding where resources are allocated and how much time is spent on project work is critical to maximize the use of the employees that are currently in the organization.
Here is a simple example to show how labor utilization can affect revenue. If labor utilization increases by 1% for a 100-person company whose bill rate is $200/hour, that will result in an annual increase of 100 resources x 1920 available hours x 1% x $200/hour, equaling a $384,000 increase (a 2% increase results in a $768,000 increase and so on). Paying attention to this critical metric can truly increase the bottom-line.
#4 Indirect Rates
Whether you are a new or experienced government contractor, optimizing your indirect rates year over year is a major challenge. Rates can be the difference between winning new contracts and growing your business vs. staying static. The right structure for your business is one that your customer is familiar with. It allows you to maximize the recovery of costs, and helps you achieve new business opportunities. Read our Indirect Rate Strategies White Paper for more details and rate strategy information!
#5 Growth
Looking at the growth rate and examining the underlying parameters is also important. This helps you define how well your new product line is performing and if you are winning new contracts. Unanet’s GAUGE Report is available for you to benchmark against companies your size. In this report, you will find important metrics such as win % and more to help you see how you stack up.
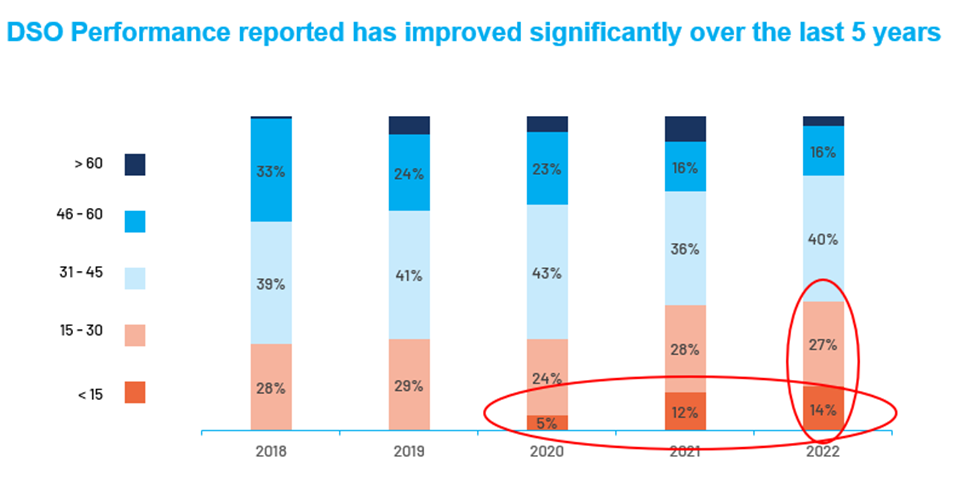
#6 Days Sales Outstanding (DSO)
This metric is simply how quickly you are turning your receivables. With DSO improving each year, there is a really good news story here for GovCons.
#7 Profit Margin
Net profit margin indicates how efficiently sales are converted to profits. Companies that generate greater profit per dollar of sales are more efficient by default. Profit should be analyzed at all levels of the business — project, program, and portfolio, to ensure nothing is left on the table. Look for efficiency in your spending to assure you are maximizing margins. Having access to profitability by department (engineering, manufacturing, etc) is also critical and gives insight to the performance of functional groups.
We hope that this review of critical KPIs gets you thinking about how to make your business more successful. Analytics tools and role-based dashboards can deliver real-time metrics directly to your device on demand Learn more here about the importance of monitoring KPIs within your own business strategy.